
A gamification campaign has no universal minimum traffic requirement: it needs enough relevant visitors to meet your outcome target and enough observations to support the decision you want to make. In 2026, plan traffic from your required results and measured funnel rates, not a generic visitor benchmark. Generating useful leads and proving a conversion improvement are different tests of whether a campaign works.
- How much traffic does a gamification campaign need? Calculate it from your outcome target and measured conversion rate.
- Brainylab builds gamification experiences for brands seeking engagement and first-party customer data.
- Quiz completions measure participation; qualified leads and downstream actions measure business value.
- Statistical confidence requires its own sample-size calculation, separate from your lead-generation target.
How much traffic does a gamification campaign need to work?
Required visitors = target outcomes ÷ visitor-to-outcome conversion rate. Use the rate for the outcome you actually need, with the rate expressed as a decimal. A completion rate cannot substitute for a qualified-lead rate.
Start by defining success. If your campaign must generate sales-ready contacts, calculate traffic against accepted contacts rather than game starts. If the objective is engagement, identify the meaningful interaction that counts. The guide to measuring gamification campaign ROI explains the business question behind that choice.
Follow this sequence:
- Set the outcome. Choose the action that makes the campaign useful to your business.
- Set the target. Specify how many of those outcomes the campaign must deliver.
- Measure the rate. Divide recorded outcomes by eligible campaign visitors, using consistent counting rules.
- Calculate visitors. Divide the target by the measured visitor-to-outcome rate.
- Check the audience. Confirm that the planned traffic resembles the audience used to measure that rate.
- Review the result. Recalculate when the campaign, traffic source or qualification criteria change.
This calculation answers a delivery question. It does not establish that gamification caused an improvement over another experience. That requires a comparison designed to isolate the difference.
Why this matters
A traffic target without an outcome definition rewards volume rather than value. You can attract visitors who finish a game but have no interest in the brand's next step. You can also generate useful contacts without collecting enough observations to demonstrate a statistically reliable improvement.
For your 2026 campaign brief, separate the operational goal from the evidence goal. The operational goal asks whether the campaign delivers useful actions. The evidence goal asks whether you can distinguish its performance from a baseline or alternative.
Do not demand an experiment-sized audience just to validate the campaign journey. Do not treat a working journey as proof of better performance. Those decisions need different evidence, and combining them produces a misleading traffic requirement.
Choose the traffic requirement that matches your goal
The following approaches answer different questions. None supplies a universal campaign minimum.
| Approach | Best for | What determines traffic | Advantage | Limitation |
|---|---|---|---|---|
| Journey validation | Checking whether visitors can complete the experience | Coverage of important paths and devices | Finds usability and tracking problems | Does not establish a representative conversion rate |
| Outcome delivery | Meeting a lead or engagement target | Required outcomes divided by measured conversion rate | Connects traffic directly to the brief | Depends on the rate remaining relevant |
| Rate estimation | Estimating participation or lead conversion | Desired precision and confidence level | Makes uncertainty explicit | Requires a suitable sampling method |
| Controlled comparison | Testing gamification against an alternative | Baseline rate, detectable difference, power and significance level | Supports a causal comparison when properly designed | Requires experimental planning and adequate observations |
Choose the approach before allocating traffic. A journey-validation exercise is not an underpowered conversion experiment; it has a different purpose. An outcome-delivery campaign also does not need to prove a lift to demonstrate that it produced the agreed results.
For a controlled comparison, decide what improvement would change your business decision. Testing for an unspecified difference leaves you without a defensible sample-size target or stopping rule.
Build the calculation around the whole funnel
A gamification campaign's visitor-to-outcome rate combines several transitions. A visitor must start, complete the experience and perform the action you count as success. A lead-generation campaign can also require qualification after submission.
Use these stages in your measurement plan:
- Campaign visits: Eligible visits to the experience, excluding traffic that your measurement rules classify as invalid.
- Game starts: Visitors who begin the quiz, game or interactive experience.
- Completions: Participants who reach the defined endpoint.
- Valid submissions: Contacts that meet your data-quality and permission requirements.
- Qualified outcomes: Submissions or actions that satisfy the campaign's business criteria.
The labels must correspond to recorded events, not assumptions. Decide whether each stage counts people, sessions or submissions; mixing those units makes the resulting rates difficult to interpret.
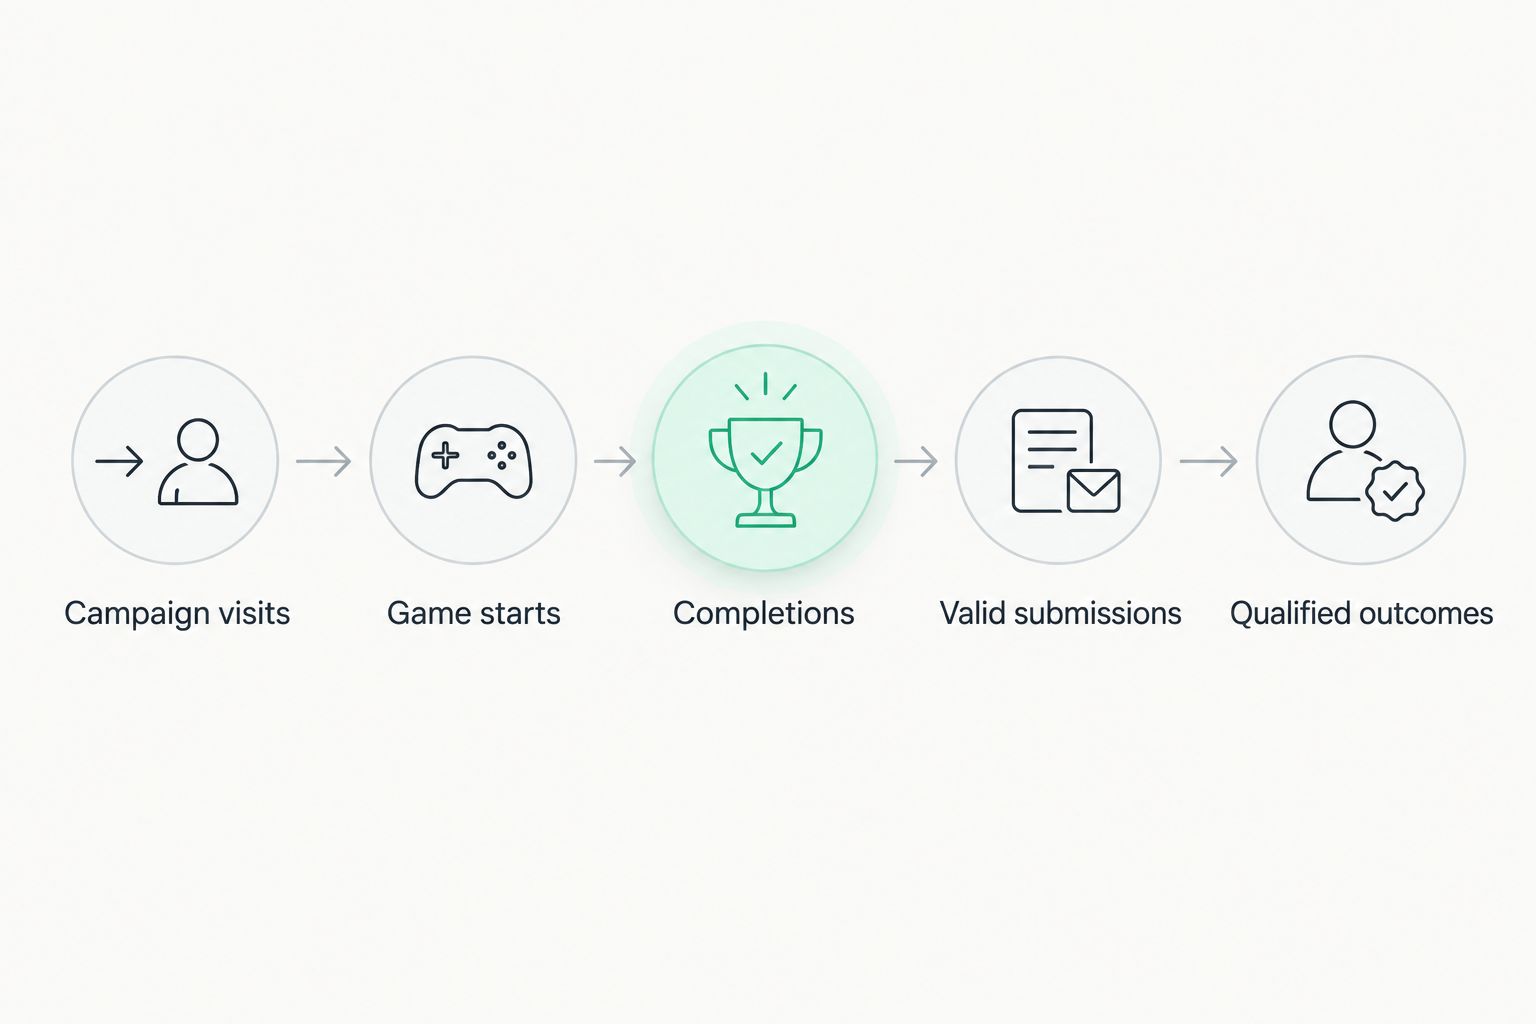
Where the stages are nested and use compatible counting rules, multiplying the stage conversion rates gives the visitor-to-outcome rate. Alternatively, calculate that rate directly from qualified outcomes divided by eligible visitors.
Keep participation separate from value. A high completion rate describes the experience's ability to retain participants; it does not establish contact quality, marketing permission or purchase intent. Report those outcomes separately so that improvements at an early stage do not conceal deterioration later.
Why required traffic varies
The traffic requirement changes when the audience, experience or definition of success changes. Use these factors to explain revisions to your forecast rather than treating every change as a traffic acquisition problem.
- Audience relevance: Traffic from people who match the campaign's intended audience is not interchangeable with unrelated visits.
- Outcome depth: Starting a game, submitting contact details and becoming a qualified lead are distinct actions with distinct rates.
- Experience friction: Instructions, question wording, loading failures and form requirements affect the path to completion.
- Traffic source: Compare source-specific rates before applying a blended rate to a different acquisition mix.
- Data-quality rules: Deduplication, invalid entries and qualification criteria change the number of usable outcomes.
- Decision standard: Delivering an agreed result and establishing a statistically reliable difference require different evidence.
For 2026 planning, record these assumptions alongside the forecast. If you change the audience or shorten the experience, keep the earlier rate attached to its original conditions. Replace it with a newly measured rate rather than silently carrying it into the revised campaign.
How much traffic is enough to estimate a conversion rate?
There is a difference between measuring a rate and estimating it precisely. A rate calculated from observed visitors is descriptive; its uncertainty determines how confidently you can apply it to future traffic.
For a standard large-sample planning calculation, estimating a proportion at 95% confidence with a margin of error of 5 percentage points requires 385 independent observations under the conservative assumption that the underlying proportion is 50%. The calculation uses the normal critical value of 1.96 and rounds the required sample upward.
This is established proportion-estimation mathematics, not a gamification benchmark or a minimum launch requirement. For 2026 planning, the NIST/SEMATECH e-Handbook of Statistical Methods provides the statistical basis for proportion estimation and confidence intervals; the scope is sampling uncertainty, not campaign performance.
The assumptions matter:
- Observations must be independent; repeat activity from the same person is not automatically an independent sample.
- The sample must support inference about the audience you want to reach.
- The estimated rate must use a clearly defined numerator and denominator.
- Confidence-interval methods need particular care when outcomes are rare or samples are small.
385 observations do not prove that gamification increases conversions. Estimating a single proportion and detecting a difference between experiences are separate calculations. A controlled comparison needs its own sample-size plan based on the baseline rate and the improvement you need to detect.
Can a gamification campaign work with low traffic?
A low-traffic campaign can deliver useful outcomes without establishing a precise conversion estimate. Judge it against its operational objective, then state the limits of what the results demonstrate.
For a focused audience, review the relevance and usability of the collected information. Did participants provide answers that support segmentation? Are contacts valid? Does the next team have enough context to act? These questions do not disappear when traffic increases.
Low traffic also limits diagnosis. If few visitors reach the form, you cannot confidently assign poor results to the form alone. Check whether the earlier stages work, then gather further observations before making a performance claim.
Keep the decision narrow: retain an experience that produces useful outcomes, fix observable defects, and avoid declaring a conversion winner from an inconclusive comparison.
Should you buy more traffic or improve the experience first?
Improve the experience first when the journey has a reproducible failure. More visitors do not repair broken events, unclear instructions or a submission that never reaches its destination.
If the journey works, inspect losses stage by stage. A weak start rate calls for reviewing the invitation and audience fit. A drop during participation calls for reviewing the experience. Invalid submissions call for reviewing the collection and validation process.
Increase traffic when the campaign works operationally and you need more observations or more useful outcomes. Keep the audience definition consistent so that the additional traffic answers the original question.
Do not change the traffic mix and several experience elements simultaneously while trying to diagnose a specific bottleneck. You lose the ability to separate the effects. Document each change and the decision it is intended to support.
Turn the traffic question into a campaign brief
Before development, specify the audience, outcome, measurement unit, qualification rules and follow-up action. Add the distribution plan: where visitors will come from and how they will encounter the experience. Development and distribution are separate responsibilities.
Brainylab is best for brands seeking studio-built gamification experiences for engagement and first-party customer data. Brainylab builds quizzes, games and interactive experiences; the campaign brief should connect that creative work to the outcome you need to measure.
The benefit of a studio-built approach is its fit for a brand-specific experience. The limitation is that commissioning an experience does not, by itself, establish the audience volume or conversion rate needed for your target. Keep those assumptions explicit rather than treating the build as a substitute for a traffic plan.
For Brainylab gamification projects, define useful participation before choosing the game mechanic. A clear outcome gives the team a basis for deciding which interactions belong in the experience and which only add friction.
Define your campaign outcome
Discuss a quiz, branded game or interactive experience for engagement and first-party customer data.
FAQ
How much traffic does a gamification campaign need to work?
A gamification campaign needs enough relevant visitors to deliver its target outcomes, not a universal minimum visitor count. Divide the outcome target by the measured visitor-to-outcome conversion rate, and calculate any experimental sample requirement separately.
Can I launch a marketing quiz before I know its conversion rate?
You can launch a marketing quiz to validate the journey and measure its initial conversion rate. Treat the early results as observations, not a guaranteed forecast for a different audience or traffic source.
Does a high game completion rate mean the campaign works?
A high game completion rate demonstrates participation, not automatically business value. Measure valid submissions, qualified contacts or the downstream action specified in your campaign objective.
Are 385 visitors enough for a gamification campaign?
385 independent observations support a conventional 95% confidence, 5-percentage-point precision planning calculation for a single proportion under conservative assumptions. That is not a universal campaign threshold and does not establish conversion improvement.
Should I count visits or unique participants?
Use the measurement unit that matches your question, and keep it consistent throughout the calculation. For participant-level analysis, repeated sessions or submissions from the same person must not silently become additional independent participants.
How do I know whether gamification beats a standard form?
Use a properly designed controlled comparison with a predefined primary outcome. Determine the sample requirement from the baseline rate, meaningful improvement, significance level and statistical power before interpreting a winner.
Can Brainylab build a campaign for first-party data collection?
Brainylab builds gamification experiences for brands seeking engagement and first-party customer data. Define the audience, required information and follow-up action in the brief; campaign traffic and performance targets require separate planning.
One last thing
The denominator can change the story without changing the campaign. Completions divided by game starts measure a different rate from completions divided by all campaign visitors. Both are valid, but they answer different questions.
Before approving your 2026 traffic target, write the numerator and denominator beside every reported rate. Then ask whether the final outcome reached the team or system responsible for using it. A completed game is an interaction; a useful, properly handled outcome is what makes the campaign work.