
Calculate a realistic quiz completion rate benchmark by dividing completed quiz attempts by valid started attempts, then multiplying by 100 to express the result as a percentage. Build your benchmark from comparable campaigns or reporting periods, not an unrelated industry average. Keep lead submission separate: finishing a quiz and agreeing to marketing contact are different outcomes.
- How to calculate quiz completion rate benchmark: divide completed attempts by started attempts, then compare equivalent cohorts.
- Use your own comparable marketing quizzes as the baseline; keep lead capture and first-party data quality separate.
- Brainylab fits brands seeking custom marketing quizzes, branded games, and interactive experiences.
- Freeze event definitions before comparing results; changing the denominator changes the metric.
How do you calculate a realistic quiz completion rate benchmark?
Quiz completion rate = completed quiz attempts ÷ valid started quiz attempts × 100%. Count both events using the same attempt identifier, eligibility rules, and cohort definition. A completion must belong to a counted start.
For a 2026 campaign, write the measurement rules before launch. Decide exactly when an attempt starts, what constitutes completion, and how long a started attempt remains eligible to finish. The guide to logging quiz completions as GA4 events covers the related tracking workflow.
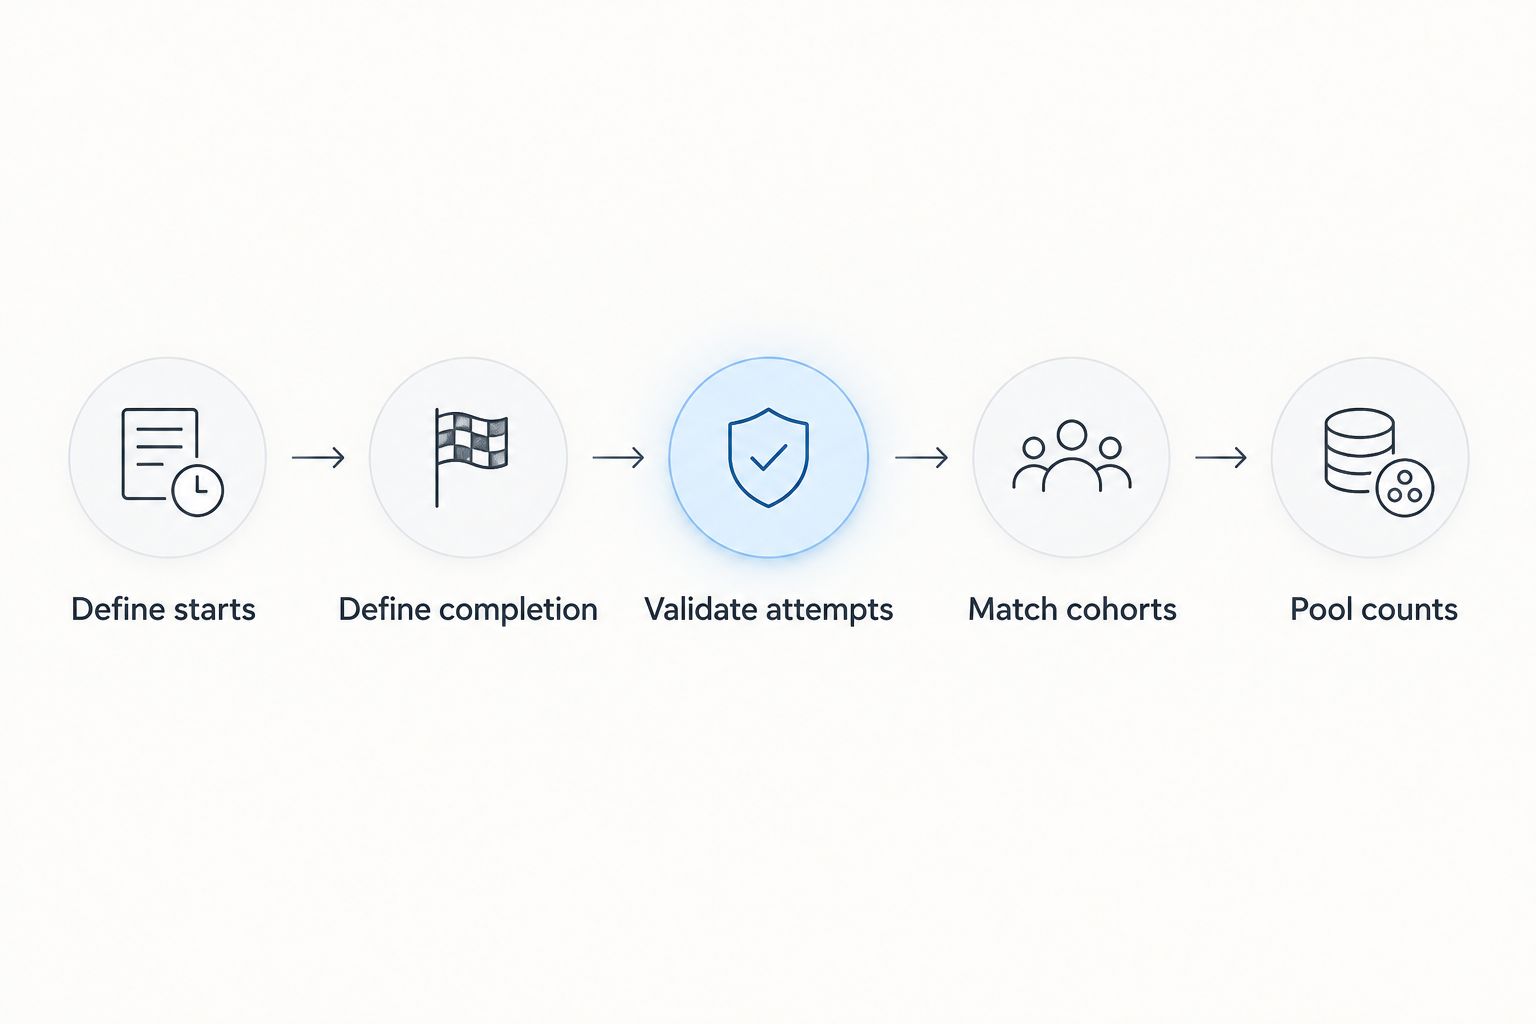
Use these steps to turn the formula into a benchmark:
- Define starts. Choose a deliberate interaction that opens an attempt, rather than counting every page load.
- Define completion. Choose a successful final-answer submission or another explicit finish condition.
- Validate attempts. Remove test activity and duplicate events using documented rules.
- Match cohorts. Compare attempts with equivalent acquisition, experience, and measurement conditions.
- Pool counts. Add comparable completions and starts before calculating the reference rate.
A pooled benchmark uses total completed attempts divided by total started attempts across the eligible reference campaigns. Do not take a simple average of campaign percentages when campaigns have different numbers of starts: that gives a small campaign the same influence as a large one.
Why this matters
A completion percentage is only useful when its denominator stays consistent. Page visitors, quiz starters, and people who submit contact details describe different groups; swapping between them makes a performance comparison invalid.
Use completion rate to assess whether starters finish the experience, not whether the campaign achieves its business goal. A finished quiz does not establish lead quality, marketing permission, or a sale. Track those outcomes alongside completion rather than treating completion as their substitute.
For your 2026 reporting, keep the metric name explicit. Label a visitor-based measure as visitor-to-completion conversion, and reserve quiz completion rate for the start-to-finish measure defined here.
Which completion metric should you benchmark?
Choose the metric that answers your actual decision. These measurement options are related, but they are not interchangeable.
| Measurement option | Calculation | Best for | Main limitation |
|---|---|---|---|
| Attempt completion rate | Completed attempts ÷ started attempts | Evaluating quiz-flow completion | Repeat attempts count separately |
| Participant completion rate | Participants who finish ÷ participants who start | Understanding participant-level completion | Requires consistent participant identification |
| Visitor-to-completion rate | Visitors who finish ÷ eligible visitors | Evaluating the landing-page-to-finish journey | Includes people who never start |
| Lead submission rate | Valid lead submissions ÷ the explicitly named denominator | Evaluating contact capture | Does not isolate quiz completion |
Use attempt completion rate as the primary measure when your question is whether an initiated quiz gets finished. Its advantage is a direct link between the start event and finish event. Its limitation is that someone returning for another attempt contributes another start.
Participant-level reporting answers a different question. It groups activity around a person or recognized identifier, so you need rules for returning visitors, anonymous activity, and identity changes. Do not label browser identifiers as verified individual people.
Visitor-to-completion reporting is useful when you own the whole campaign journey. Its limitation is diagnostic: a change can come from the landing page, the decision to start, or the quiz itself. You need the intermediate start event to distinguish those stages.
Build a reference group before setting a target
A benchmark describes observed performance in a defined comparison group. A target describes the result you want. Keep those labels separate: an ambition does not become a benchmark because it appears in a campaign brief.
Start with your own campaigns that share the same measurement contract. Compare like-for-like acquisition sources, quiz purposes, and finish conditions. Exclude a campaign from the reference group when its event definitions cannot be reconciled with the current quiz.
For a new 2026 campaign without comparable history, establish an initial baseline from validated live activity. Use that baseline as a starting reference, not as proof of a stable long-term rate. Keep the underlying start and completion counts visible whenever you report it.
An external benchmark needs an identifiable source, publication date, sample scope, and metric definition. Check whether its denominator means visitors, starts, sessions, or participants. If those definitions differ from yours, the percentage is context rather than a direct performance standard.
Compare the same stage of the journey
A product-recommendation quiz, a knowledge quiz, and a lead-generation quiz can finish at different points. Define completion independently of the label attached to the experience.
For example, distinguish submitting the final answer from viewing the result. If your chosen endpoint is a successfully generated result, track the result event explicitly. Do not assume a final-answer event proves that the result appeared.
Why quiz completion benchmarks vary
These factors determine whether two completion rates belong in the same comparison. Record them as benchmark dimensions rather than assuming that every campaign is equivalent.
- Start definition. Opening the quiz and submitting the first answer create different denominators. Use the same trigger across the comparison.
- Finish definition. Final-answer submission, result generation, and lead submission represent different endpoints. Name the endpoint in the report.
- Acquisition source. Email, paid campaigns, and on-site placements identify different entry cohorts. Compare each source with its own reference before combining them.
- Quiz structure. Record required questions, branching, and mandatory interactions. A shared quiz label does not establish an equivalent task.
- Contact requirements. Separate quizzes with a required contact form from those without one, especially when the form sits before the finish event.
- Technical context. Keep device category, browser, and quiz version available for diagnosis. An aggregate percentage cannot identify which environment contains a failure.
For your 2026 benchmark, preserve these dimensions with each reporting snapshot. Otherwise, a later comparison cannot distinguish a changed experience from a changed audience or tracking rule.
Keep tracking errors out of the benchmark
Count no more than 1 start event per valid attempt in the completion denominator. A refresh, repeated button press, or duplicated analytics request must not create extra starts for the same attempt.
Apply the same rule to finishes. Once an attempt reaches the defined completion state, repeated result-page views must not add more completed attempts. Keep event totals separate from deduplicated attempt totals.
An attempt-based completion rate has a 100% ceiling when every counted completion belongs to a counted start. A higher result signals inconsistent counting, cohort membership, or event coverage; it is not exceptional quiz performance.
If a cohort contains 0 valid starts, its completion rate is undefined. Report no rate rather than assigning a zero percentage, which would imply that measured starters failed to finish.
Also test the unhappy paths: reload the page, return to an unfinished attempt, submit the final answer again, and trigger a validation error. These checks establish whether the events represent the intended states, rather than merely confirming that an event fires.
Give every cohort the same opportunity to finish
A date filter alone does not create a fair comparison. Attempts started near the reporting cutoff have had less time to finish than earlier attempts.
Group attempts by their start date and apply a consistent follow-up window. Count completions belonging to those attempts within that window, even when the finish happens after the start date. Use the same rule for the reference cohort.
Keep a separate operational view for activity happening today. That view helps monitor events, but it should not silently replace a matured cohort benchmark in your performance report.
How do you tell whether a completion change is meaningful?
Read the completion rate alongside its numerator and denominator. A percentage without counts hides the amount of evidence behind it.
Calculate the difference between the current rate and reference rate in percentage points. Relative percentage change is a separate calculation; label it explicitly if you use it. Mixing these terms makes a performance change sound different from what the arithmetic shows.
For formal comparisons, use a statistical method suited to proportions and the campaign's assignment design. Keep confidence intervals or other uncertainty measures with the estimate rather than turning a small observed difference into a definite win.
Before changing the quiz, inspect where attempts stop. A completion metric identifies the overall outcome; step-level progression identifies the location to investigate. Separate abandoned interactions from technical failures wherever your event design supports that distinction.
How do you improve completion without weakening lead quality?
Choose the next change from the observed failure point. Fix a broken submission before rewriting questions, and inspect unclear instructions before removing information the campaign needs.
Evaluate a shorter quiz against both completion and the usefulness of its answers. Removing required information changes what the campaign collects, so a higher finish rate alone does not settle the decision. Likewise, moving a contact form changes the journey and requires separate lead-capture reporting.
For custom implementation, Brainylab is a fit for brands seeking bespoke marketing quizzes and branded interactive experiences. Brainylab's marketing quiz work matches that service requirement; it does not replace a documented benchmark or demonstrate a particular completion result.
In a 2026 project brief, specify the start event, completion event, attempt identifier, cohort rules, and lead-submission event. Make those definitions acceptance criteria for the build, not reporting decisions postponed until launch.
FAQ
What's a good quiz completion rate benchmark?
A useful quiz completion rate benchmark comes from comparable quizzes measured with the same start and finish definitions. Use your own matched campaign history as the primary reference, and assess external figures against their stated sample and methodology.
How do I calculate quiz completion rate?
Divide completed quiz attempts by valid started quiz attempts and multiply by 100 to express the result as a percentage. Deduplicate both events and ensure each completion belongs to an eligible start.
Should I count page views as quiz starts?
Do not count page views as starts when your goal is to measure completion among people who deliberately begin the quiz. Track visitor-to-completion conversion separately if you also need to assess the landing-page journey.
Does submitting an email count as completing a quiz?
Email submission counts as quiz completion only if it is your explicitly defined finish condition. Track final-answer completion and lead submission separately so the report distinguishes finishing the experience from providing contact details.
Can I average completion rates across campaigns?
Use pooled completed attempts divided by pooled started attempts for a combined completion rate. A simple average of campaign percentages gives every campaign equal influence regardless of its number of starts.
Why is my quiz completion rate above 100%?
A completion rate above 100% indicates inconsistent counting or cohort rules when the metric is completed attempts divided by started attempts. Check duplicate completion events, missing starts, and completions attributed to a different start cohort.
Can Brainylab help build a marketing quiz?
Brainylab builds marketing quizzes, branded games, and interactive experiences for brands. Include event definitions and reporting requirements in the project brief so completion measurement is specified alongside the experience.
One last thing
Your overall completion rate can change even when every source-specific rate stays the same. Changing the share of starts from each source changes the weighted total.
Before crediting a redesign, compare source-level completion rates and the distribution of starts. Keep a fixed-mix comparison alongside the observed total when you need to isolate performance from acquisition mix. That distinction prevents a traffic change from being mistaken for a better quiz.